|
Getting your Trinity Audio player ready...
|
Top 8 Best Data Analysis Tools
Modern businesses are heavily reliant on data analysis. It can be tough to choose the right data analytics tool because no single solution can suit all of your needs.
Let’s take a look at top 8 best data analysis tools on the market today to see which one is best for your company.
Additionally, before you can begin analyzing data, you must first select data sources, tables, and columns within them, and duplicate them to a data warehouse to create a single source of truth for analytics.
You should also think about data governance and security. Access control and permission procedures should be in place if data is shared between departments, for example.
Most Popular Data Analysis Tools
1. Microsoft Excel
Microsoft Excel is a fundamental, well-known, and commonly utilized analytical tool in practically every industry. You will still need to utilize Excel, whether you are an expert in SAS, R, or Tableau.
When there is a need for analytics on the client’s internal data, Excel comes in handy.It analyses the complicated work and summaries the data with a preview of pivot tables that aid in filtering the data according to the client’s needs.
Excel includes an advanced business analytics option that aids in modelling capabilities with built-in features such as automatic relationship recognition, DAX measure development, and temporal grouping.
Microsoft Excel is the most widely used program for creating spreadsheets and doing analyses. Excel can accommodate practically any conventional analytics workflow and can be extended using its native programming language, Visual Basic, thanks to decades of development.
Excel is great for easy analysis, but it is not suitable for analyzing large amounts of data (it has a limit of roughly 1 million rows) and lacks adequate collaboration and versioning tools.
For large and collaborative studies, businesses should explore more sophisticated cloud-based analytics tools.
2. Python
Python is a free open source object-oriented scripting language that is simple to read, write, and maintain. It was developed in the late 1980s by Guido van Rossum and supports both functional and structured programming methodologies.
Python is simple to learn because it resembles JavaScript, Ruby, and PHP. Scikitlearn, Theano, Tensorflow, and Keras are just a few of Python’s machine learning libraries.
Python also has the advantage of being able to be built on any platform, such as a SQL server, a MongoDB database, or JSON. Python performs really very good at handling text data.
Python’s object-oriented nature allows data scientists to complete jobs with greater stability, modularity, and readability because to its object-oriented nature.
Python allows data scientists to create complex data models that can be directly integrated into a production system. Python provides a wealth of tools and libraries for data analytics and all that comes before it.
3. R
R is the ideal statistical tool for Data Science. It’s more than a language. It’s a whole environment for performing statistical calculations. It comes with built-in features that make data processing, mathematical modelling, and data visualization easier.
R is the industry’s most popular analytics tool, and it’s widely used for statistics and data modelling. It can effortlessly manipulate and present your data in a variety of ways. In many ways, it outperforms SAS in terms of data capacity, performance, and output. R can be compiled and run on a broad range of operating systems, including UNIX, Windows, and MacOS. It has 11,556 packages to choose from, and you may explore them by category.
R also has tools for automatically installing all packages based on the needs of the user, which can be used in conjunction with Big Data.

4. SAS (Statistical Analytical System)
SAS is a tool for advanced data analysis and complex statistical computations, similar to R. It’s a proprietary closed-source application with a wide range of statistical features for sophisticated modelling.
Because of its excellent reliability, SAS is mostly employed by major enterprises and professionals.
SAS is a data manipulation programming environment and language that was established by the SAS Institute in 1966 and subsequently refined in the 1980s and 1990s. SAS is simple to use, manageable, and capable of analyzing data from a variety of sources.
In 2011, SAS released a significant range of customer intelligence solutions, as well as various SAS modules for online, social media, and marketing analytics, which are frequently used for profiling consumers and prospects.
It can also predict their actions, regulate their communications, and optimize them.
5. Tableau
Tableau is a Business Intelligence (BI) solution for data analysts that allows them to see, analyses, and comprehend their data. Tableau is simple to learn and use.
Tableau is not a free program, and the cost varies depending on the data requirements.
Tableau is a quick analytics tool that can explore any sort of data, including spreadsheets, databases, and Hadoop and cloud data.
It’s simple to use since it includes robust drag-and-drop capabilities that anyone with a creative mind can use.
Smart dashboards allow data visualization to be shared in seconds. Amazon, Citibank, Barclays, LinkedIn, and many other firms utilize Tableau.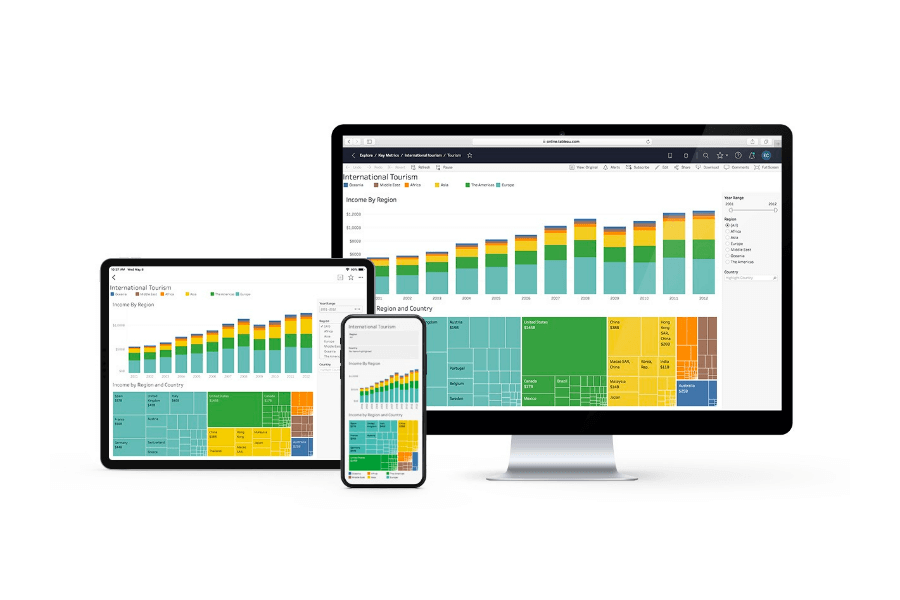
Tableau
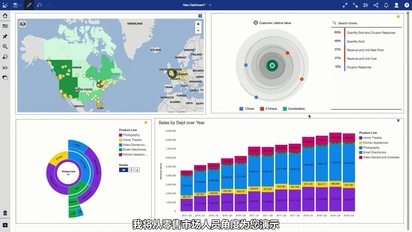
6. IBM Cognos
IBM Cognos is a business intelligence platform with built-in artificial intelligence algorithms that unearth hidden data insights and explain them in plain English.
IBM Cognos also provides automated data preparation capabilities that automatically cleanse and consolidate data sources, allowing for speedy data integration and experimentation.
Ventana Research’s “Analytics and Data Value Index” for 2021 places IBM #1 in the overall vendor rating. In the categories of Product Experience, Customer Experience, and TCO/ROI, IBM Cognos Analytics is a Leader, and it is placed top in both Product Capability and Manageability.
7. Splunk
Splunk is a more well-known data analytics platform than Cloudera and Hortonworks. It have started with log tracking from Google meaning that its primary purpose was to process data from machine log files.
Splunk have grown itself into many more areas since then. Splunk features excellent visualization capabilities and a user-friendly online interface.
Splunk allows you to use any type of data for real-time, machine-speed action. With Splunk, you can thrive in the data age. 91 of the Fortune 100 rely on Splunk to answer every question, make every decision, and take every action.

8. QlikView
Between the data visualization behemoths, QlikView and Tableau are effectively jostling for first place. QlikView is said to be slightly faster than Tableau and to provide more flexibility to skilled users.
Tableau provides best user-friendly interface and is easier to pick up for beginners. The same cutting-edge technology is used to create QlikView and QlikSense.
When data takes the lead, transformation is inevitable. Begin your free Qlik trial right now! Integration of data. Analytics Software as a Service (SaaS).
There are almost 50,000 customers. Solutions for business intelligence and analytics. There are about a hundred countries represented.

That is it as of now about our top 8 best data analysis tools 2021 list.You can explore based on your comfort level in these tools.
Conclusion
Thank you very much for going through our listicle of top 8 best data analysis tools .We recommend to start analysis with excel itself as it may be on your desktop without downloading as part of Microsoft Office if not you can use online version of MS Office as well then progressively move to other options available.